UoH 2020 Question 50: Joint distributions, covariance and correlation
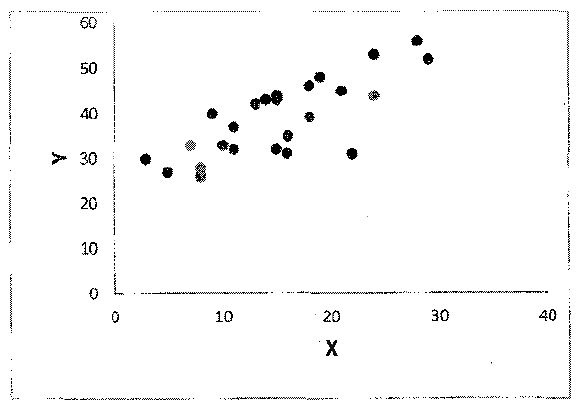
See the scatter-plot given below:
[Scatter plot of Y (vertical axis, 0 to 60) against X (horizontal axis, 0 to 40). The cloud of about 25 points rises from roughly (3, 30) at the lower left to roughly (29, 53) at the upper right.]
Scatter plot of Y (vertical axis, 0 to 60 in steps of 10) against X (horizontal axis, 0 to 40 in steps of 10), with about 25 points for X between about 3 and 29. Y rises from about 26 to 33 at low X to about 52 to 56 at X near 28 to 29, a clear upward-sloping but scattered pattern that does not pass through the origin.
Tap an option to check your answer.
Answer and worked solution
Checking your account…
Joint distributions, covariance and correlation has come up 61 times in 7 exams since 2005.
What this question tests
This question is on The correlation coefficient, part of Joint distributions, covariance and correlation in Statistics.
The standardised measure of linear association and what it can and cannot show.
TestStop has 35 past-paper questions on this subtopic.