
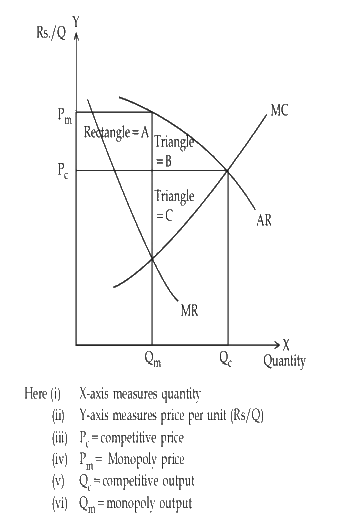
Comprehension - Social cost of monopoly power (diagram). A demand/AR curve, MR curve and an upward-sloping MC curve are drawn. The competitive price-quantity is where MC = AR, and the monopoly price-quantity is where MR = MC (, ). The area between and up to is rectangle A; the upper triangle (to the AR curve) is B; the lower triangle (between AR and MC) is C.
Question: Find the consumer loss due to the move from the competitive to the monopoly price ( to ):
Tap an option to check your answer.