Skip to content
We use only essential cookies to keep you signed in and remember your preferences. See our Cookie Policy.
TestStop
MocksPracticeResourcesIndiaBlogPricing
Sign in
Questions › JNU › JNU SIS 2016 › Q15
2 marks, −1Economics of Growth and Development › Poverty, inequality and human development › The Lorenz curve and the Gini coefficientEasyabout 1 min

JNU SIS 2016 Question 15: Poverty, inequality and human development

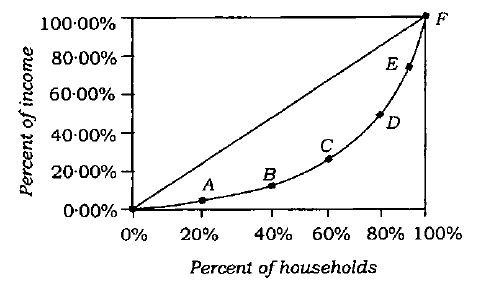
According to the graph given below, which of the following statements is true?

Lorenz curve diagram: the horizontal axis is 'Percent of households' from 0% to 100% (ticks at 0%, 20%, 40%, 60%, 80%, 100%, drawn with spacing that narrows toward the right) and the vertical axis is 'Percent of income' from 0·00% to 100·00% (ticks every 20%). A straight diagonal line of equality runs from the origin to the top-right corner F (100%, 100%), and below it a convex Lorenz curve runs from the origin through labelled points A (20% of households, about 5% of income), B (40%, about 12%), C (60%, about 26%), D (80%, about 49%) and E (about 90% of households, about 74%) up to F, sagging well below the diagonal.

Tap an option to check your answer.

Answer and worked solution

Checking your account…

Poverty, inequality and human development has come up 92 times in 7 exams since 2010.

What this question tests

This question is on The Lorenz curve and the Gini coefficient, part of Poverty, inequality and human development in Economics of Growth and Development.

Showing and summarising inequality in a distribution.

TestStop has 19 past-paper questions on this subtopic.
Practise Poverty, inequality and human developmentMore on The Lorenz curve and the Gini coefficient

Similar questions from other papers

  • GATE 2026 · Q54Which of the following statements concerning Millennium Development Goals (MDGs) and Sustainable Development Goals (SDGs) is/are CORRECT?
  • UGC-NET 2026 · Q47Human Development Index (HDI) prepared by UNDP has following components: A. Life Expectancy B. Literacy C. Infant Mortality D. Per-capita Income
  • GATE 2025 · Q36Which of the following statements is/are CORRECT?
  • UGC-NET 2025 · Q10The Human Development Index (HDI) is used to rank countries based on:
  • UGC-NET 2025 · Q34The idea of constructing poverty-weighted indices of growth is:

Question from the JNU SIS 2016 paper. Solutions are TestStop's own. Not affiliated with or endorsed by any examination authority.
