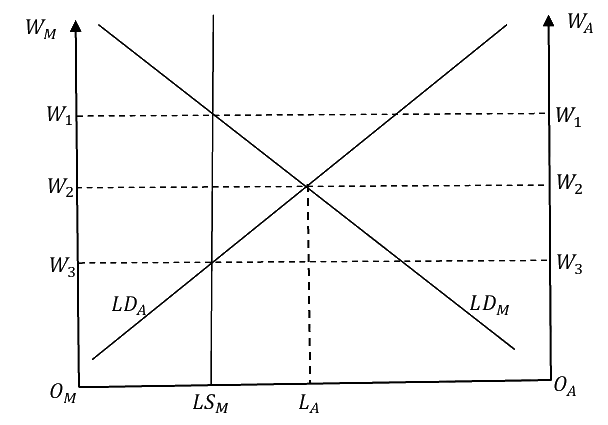
A dual economy consisting of a manufacturing sector (M) and an agricultural sector (A) is depicted in the figure below. OMOA is the total labour available in the economy of which OMLSM is the labour supply in the manufacturing sector before any migration was allowed among the labourers. The vertical axis on the left (right) side measures the wage in the manufacturing, WM (agricultural, WA) sector. LDM (LDA) is the demand of labour in the manufacturing (agricultural) sector with respect to OM (OA) as the origin. If wages are flexible, and labour is allowed to migrate between these two sectors, then it will be TRUE that
[Diagram: a back-to-back labour-market box diagram. Horizontal axis runs from OM (left origin) to OA (right origin), with the fixed labour split point LSM marked partway along, and the eventual equilibrium migration point LA marked to its right. LDA is an upward-sloping labour demand curve from OM's side, LDM is a downward-sloping labour demand curve from OA's side; they cross at a single point directly above LA, at height W2 on both the WM and WA axes. Before migration, reading the demand curves at the fixed split LSM gives wage W1 in one sector and W3 in the other.]
Two-sector labour market box. The horizontal axis runs from origin O_M (left) to O_A (right) and measures total labour; the left vertical axis is the manufacturing wage W_M and the right vertical axis is the agricultural wage W_A, with wage levels W1 > W2 > W3 marked on both sides by dashed lines. LD_M slopes down from top left to bottom right, LD_A slopes up from bottom left to top right (measured from O_A), and they cross at wage W2 above point L_A; a solid vertical line at LS_M, left of L_A, meets LD_M at W1 and LD_A at W3.
Tap an option to check your answer.
Answer and worked solution
Checking your account…
Plain-text version
A dual economy consisting of a manufacturing sector (M) and an agricultural sector (A) is depicted in the figure below. O_MO_A is the total labour available in the economy of which O_MLS_M is the labour supply in the manufacturing sector before any migration was allowed among the labourers. The vertical axis on the left (right) side measures the wage in the manufacturing, W_M (agricultural, W_A) sector. LD_M (LD_A) is the demand of labour in the manufacturing (agricultural) sector with respect to O_M (O_A) as the origin. If wages are flexible, and labour is allowed to migrate between these two sectors, then it will be TRUE that [Diagram: a back-to-back labour-market box diagram. Horizontal axis runs from O_M (left origin) to O_A (right origin), with the fixed labour split point LS_M marked partway along, and the eventual equilibrium migration point L_A marked to its right. LD_A is an upward-sloping labour demand curve from O_M 's side, LD_M is a downward-sloping labour demand curve from O_A 's side; they cross at a single point directly above L_A, at height W₂ on both the W_M and W_A axes. Before migration, reading the demand curves at the fixed split LS_M gives wage W₁ in one sector and W₃ in the other.] (A) Total amount of labour that will migrate from the agricultural sector to the manufacturing sector will be L_ALS_M (B) Total amount of labour that will migrate from the manufacturing sector to the agricultural sector will be LS_ML_A (C) The wage in the manufacturing sector will be W₃ (D) The wage in the agricultural sector will be W₁
Also written as: A dual economy consisting of a manufacturing sector (M) and an agricultural sector (A) is depicted in the figure below. O_MO_A is the total labour available in the economy of which O_MLS_M is the labour supply in the manufacturing sector before any migration was allowed among the labourers. The vertical axis on the left (right) side measures the wage in the manufacturing, W_M (agricultural, W_A) sector. LD_M (LD_A) is the demand of labour in the manufacturing (agricultural) sector with respect to O_M (O_A) as the origin. If wages are flexible, and labour is allowed to migrate between these two sectors, then it will be TRUE that [Diagram: a back-to-back labour-market box diagram. Horizontal axis runs from O_M (left origin) to O_A (right origin), with the fixed labour split point LS_M marked partway along, and the eventual equilibrium migration point L_A marked to its right. LD_A is an upward-sloping labour demand curve from O_M 's side, LD_M is a downward-sloping labour demand curve from O_A 's side; they cross at a single point directly above L_A, at height W_2 on both the W_M and W_A axes. Before migration, reading the demand curves at the fixed split LS_M gives wage W_1 in one sector and W_3 in the other.]
Theories of development has come up 59 times in 6 exams since 2010.
What this question tests
This question is on Dual-economy models, surplus labour and migration, part of Theories of development in Economics of Growth and Development.
Models of a traditional sector that supplies labour to a modern one.
TestStop has 24 past-paper questions on this subtopic.