DSE 2016 Question 2: Descriptive statistics and dispersion
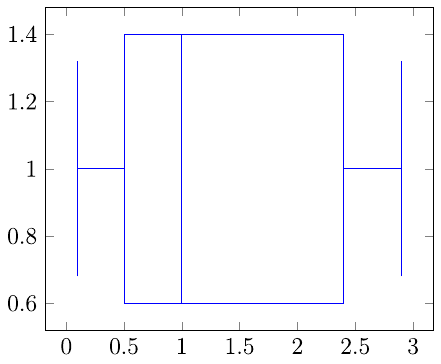
What term would best describe the shape of the given boxplot? [Figure: a horizontal boxplot on a data axis running 0 to 3, with minimum ≈0.1, first quartile ≈0.5, median ≈1.0, third quartile ≈2.4, and maximum ≈2.9. The median sits close to the first quartile, and the upper half of the box (median to Q3) is much wider than the lower half.]
Horizontal boxplot drawn on a horizontal scale from 0 to 3 (ticks every 0.5); the vertical axis (0.6 to 1.4) only sets the box height and carries no data. The left whisker runs from about 0.1 to the box's left edge at 0.5 (Q1), the median line is at 1, the box's right edge (Q3) is at about 2.4, and the right whisker extends to about 2.9, so the median sits much closer to Q1 than to Q3.
Tap an option to check your answer.
Answer and worked solution
Checking your account…
Plain-text version
What term would best describe the shape of the given boxplot? [Figure: a horizontal boxplot on a data axis running 0 to 3, with minimum ≈ 0.1, first quartile ≈ 0.5, median ≈ 1.0, third quartile ≈ 2.4, and maximum ≈ 2.9. The median sits close to the first quartile, and the upper half of the box (median to Q3) is much wider than the lower half.] (A) Right-skewed (B) Left-skewed (C) Uniform (D) Normal
Also written as: What term would best describe the shape of the given boxplot? [Figure: a horizontal boxplot on a data axis running 0 to 3, with minimum ~= 0.1, first quartile ~= 0.5, median ~= 1.0, third quartile ~= 2.4, and maximum ~= 2.9. The median sits close to the first quartile, and the upper half of the box (median to Q3) is much wider than the lower half.]
Descriptive statistics and dispersion has come up 117 times in 6 exams since 2004.
What this question tests
This question is on Skewness and kurtosis, part of Descriptive statistics and dispersion in Statistics.
The shape of a distribution: asymmetry and peakedness.
TestStop has 22 past-paper questions on this subtopic.